At museum check-in, four sample waits are between three and five minutes. One takes fourteen. SKEW describes the asymmetry of that sample, and the sorted waits show what drives it.
Enter 3, 4, 4, 5 and 14 in B2:B6 and calculate =SKEW(B2:B6) in D2. Expect approximately 2.10. Enter 3, 4, 5, 6 and 7 in C2:C6 as a control and calculate =SKEW(C2:C6). Expect zero for the symmetric control.
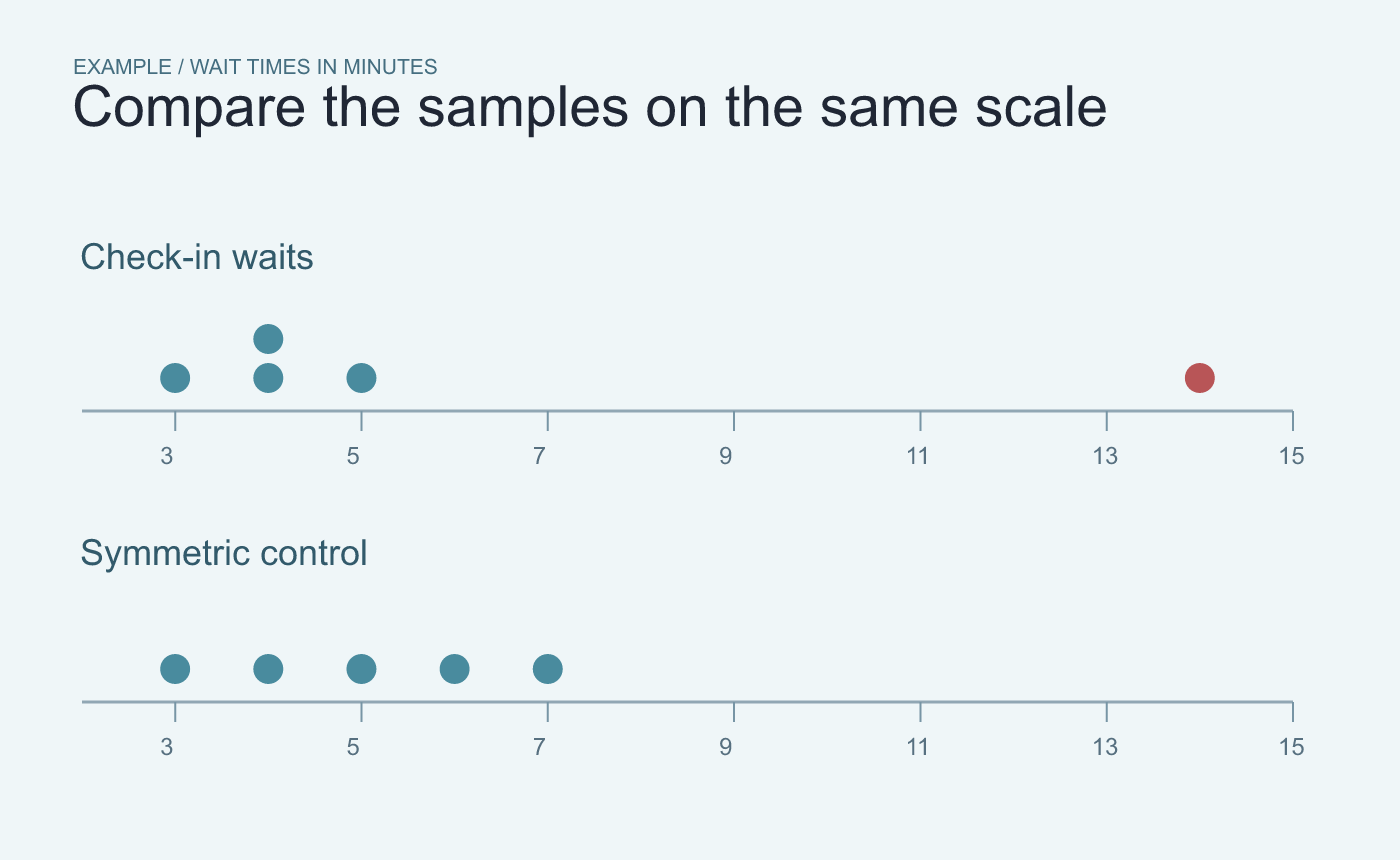
Example observations. Plot the values on the same scale before reading the statistic.
Investigate the long wait before drawing a conclusion
In the first column, 14 sits farther to the right than the other values sit to the left. That is consistent with the positive result. Check the original timestamp pair for that row. It might represent a genuine queue delay or a timing issue. Either way, report the observation count and the unit with the result.
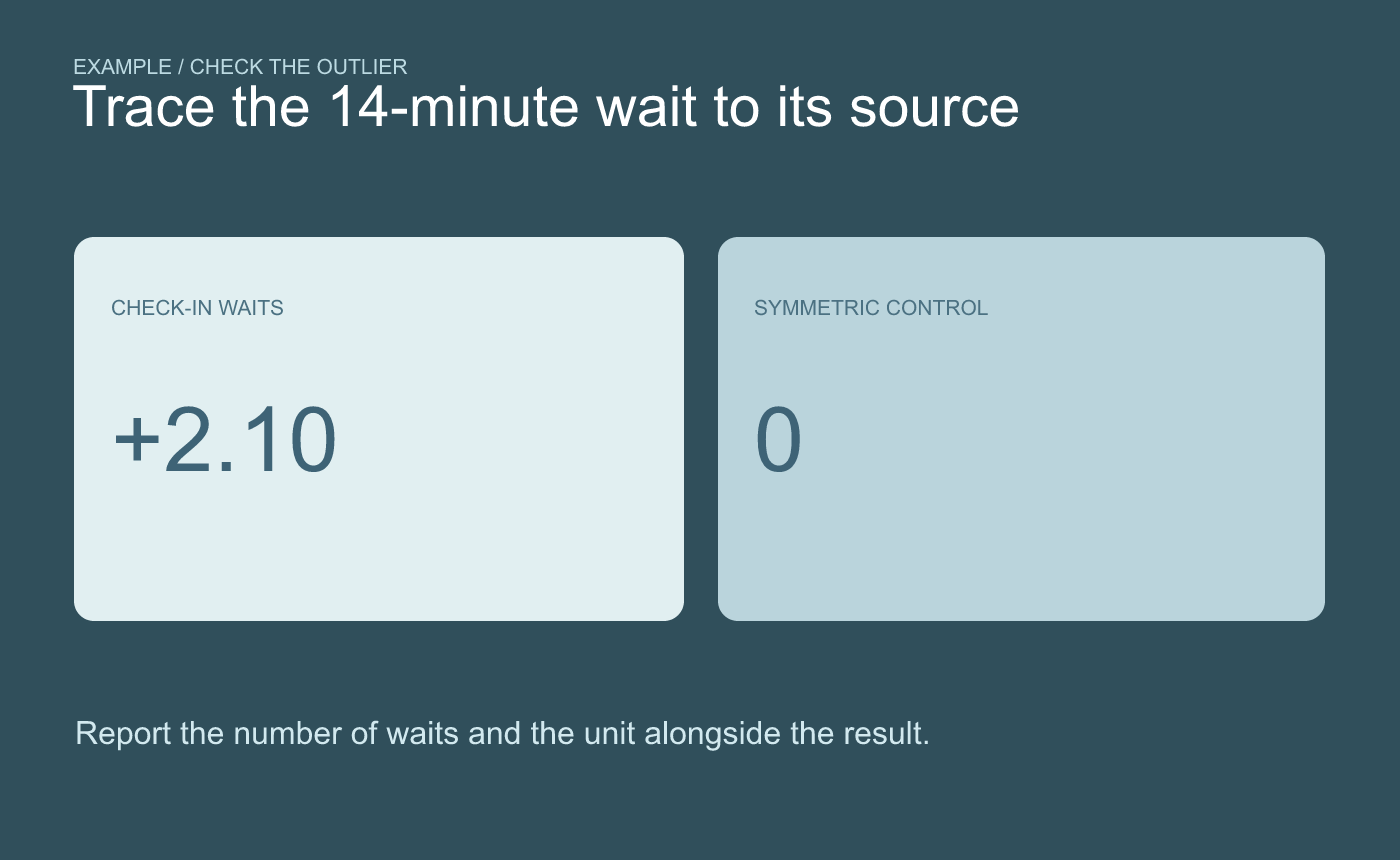
Example check. Trace the long wait to its source before explaining the skew.
Keep both the plot and the statistic in your workbook. A single value can strongly affect a sample of five waits, so avoid using the statistic alone to characterize a whole day.