The site supply sheet shows extra stock on one order and shortages on two others. The orders go to separate sites, so the extra units do not fill either shortage. Calculate the gap for each order before adding them up.
Line up requests with their deliveries
Enter requested counts 18, 6, 12 and 5 in B2:B5 and delivered counts 14, 9, 10 and 5 in C2:C5. Check that each pair belongs to the same order ID. Then calculate the row-level shortage total.
=SUMPRODUCT((B2:B5>C2:C5)*(B2:B5-C2:C5))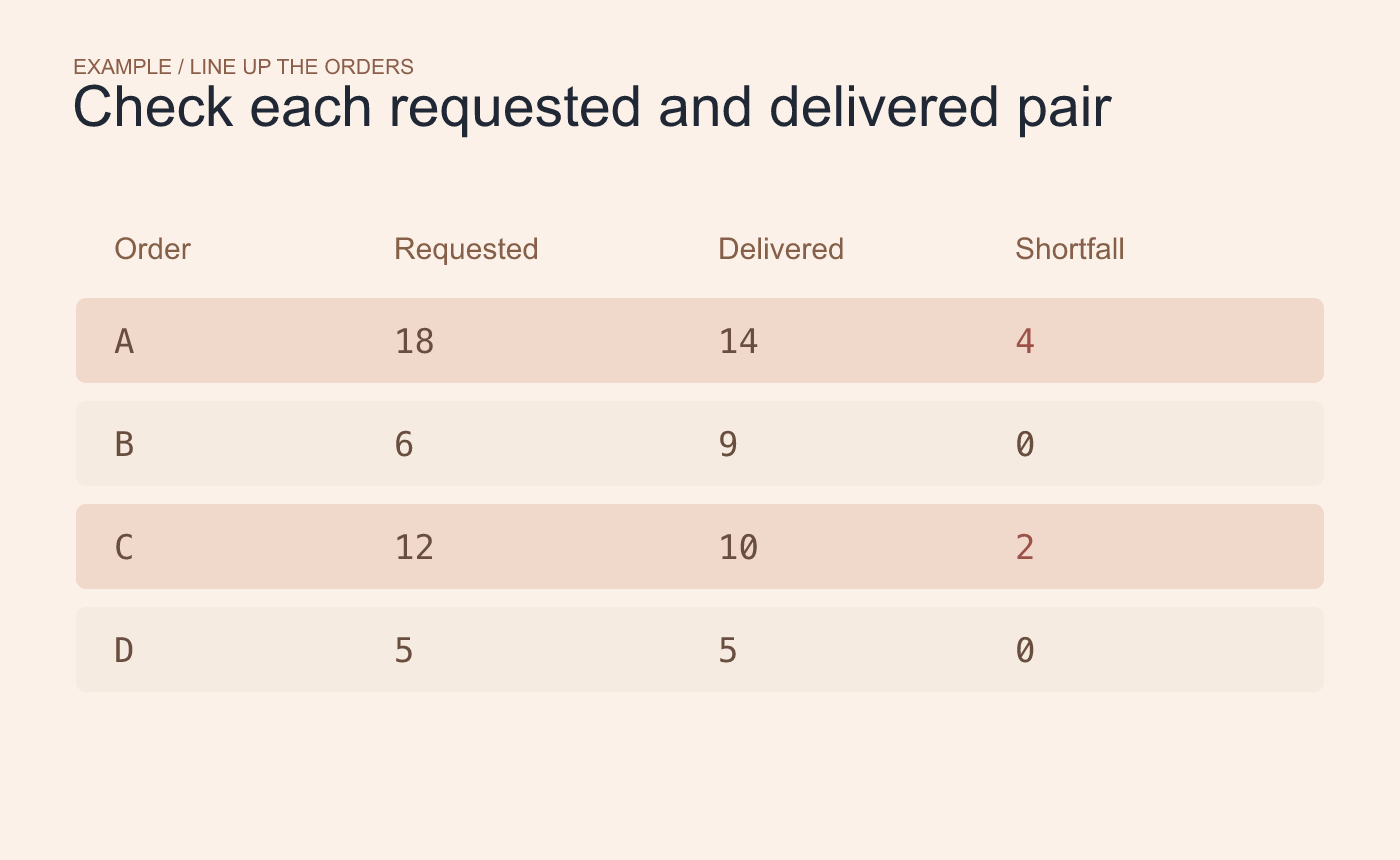
Example request and delivery pairs. Match the order IDs before calculating.
Check the result against the four rows
The comparison includes only rows where the request exceeds delivery. The shortfalls are 4, 0, 2 and 0, for a total of 6. Subtracting the two column totals instead gives 3 because it offsets the shortages with a surplus of 3.
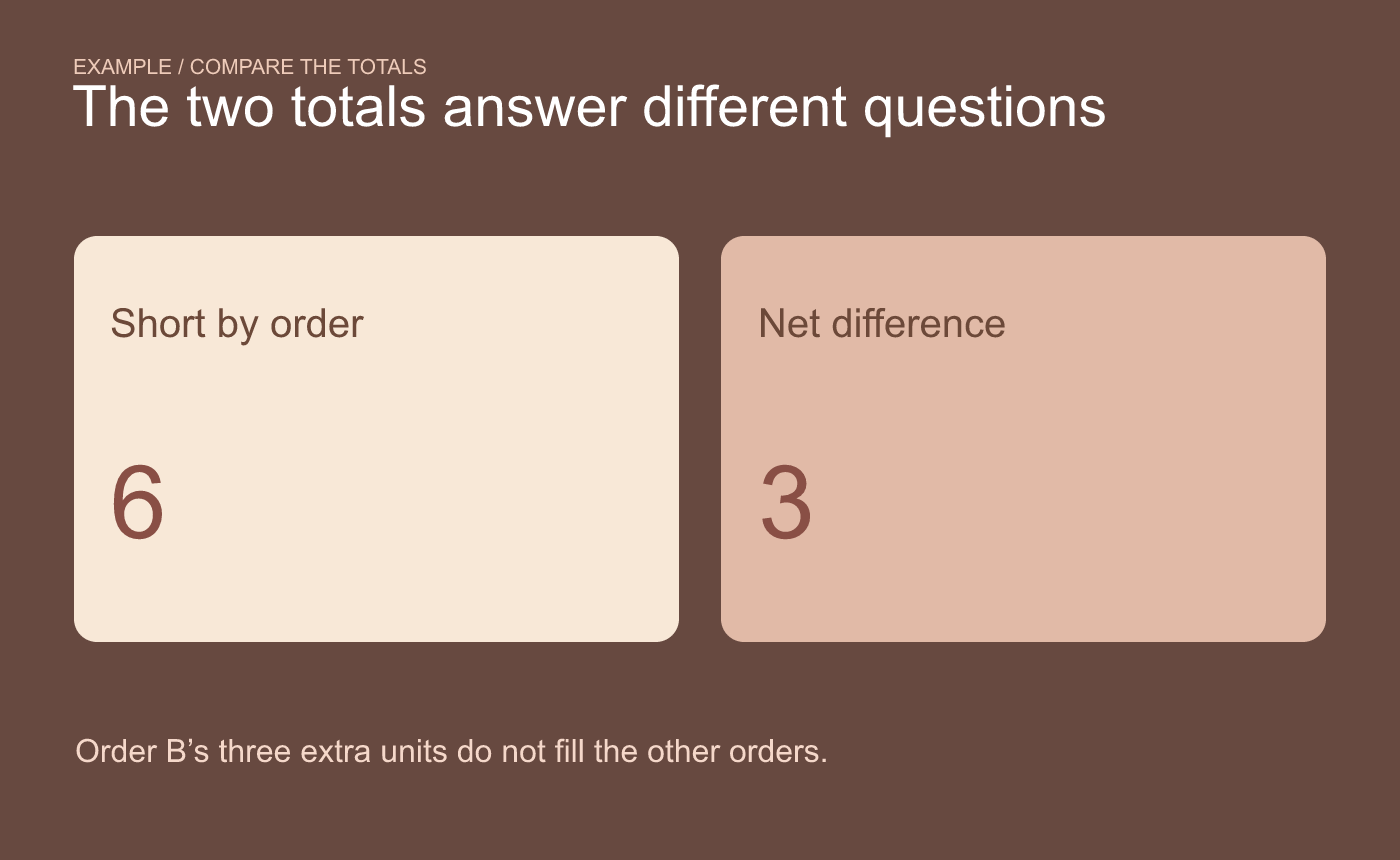
Example totals. The surplus hides three missing units when the counts are netted.
Label the two totals differently if you need both. If a delivery count is missing, decide whether it means no units arrived or the delivery has yet to be recorded before including that row.