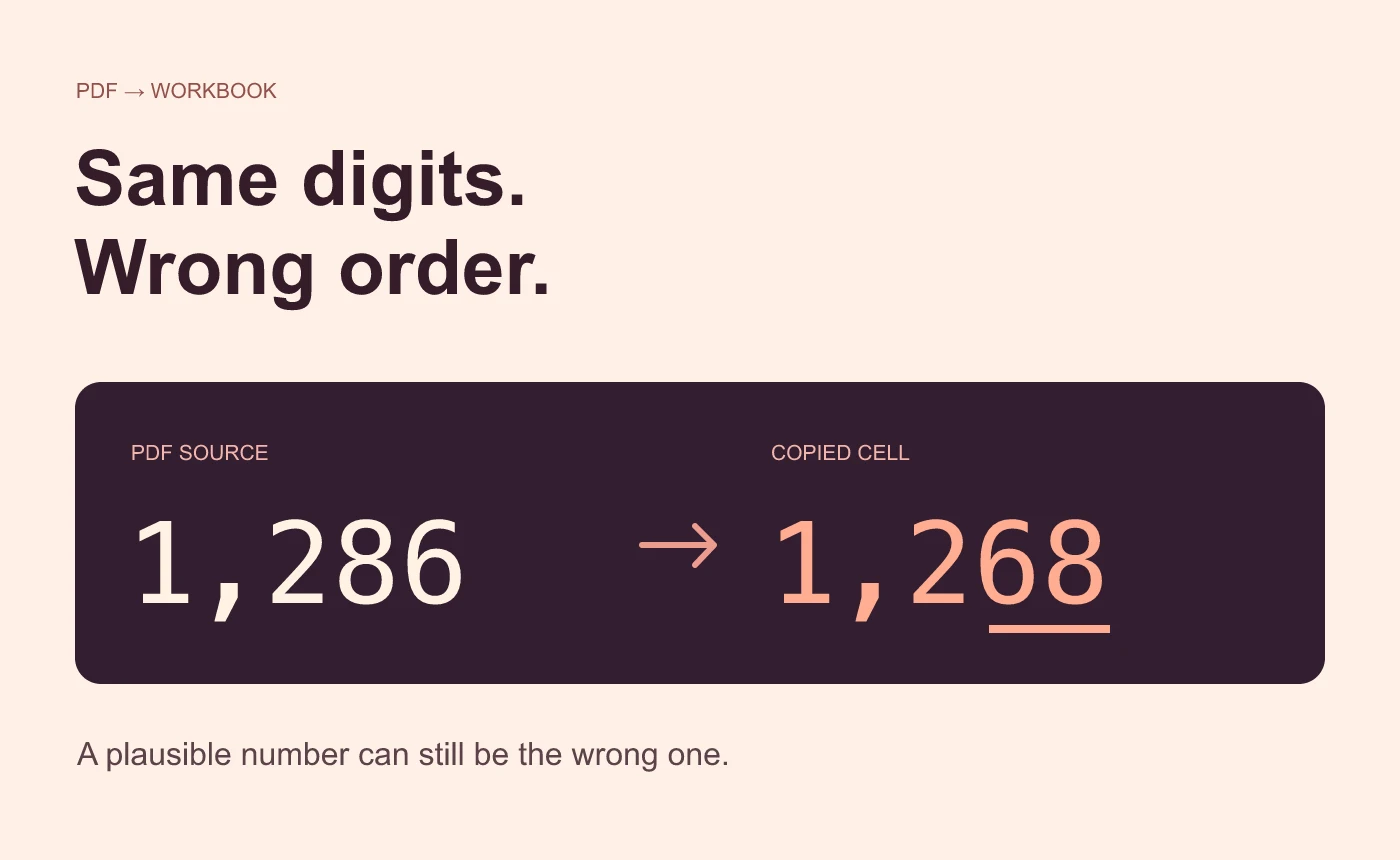
The quality log has three numeric checkpoints for each test. A reading of zero means someone recorded a measurement. An empty cell means the reading is still missing. Count those states differently for each test row.
Apply COUNT to one row at a time
In B2:D2, enter 12, leave C2 empty and enter 0 in D2. Enter 4, 6 and 2 in B3:D3. In a spreadsheet editor with BYROW and LAMBDA, clear the two destination cells in G2:G3 and enter this in G2.
=BYROW(B2:D3,LAMBDA(checkpoints,COUNT(checkpoints)))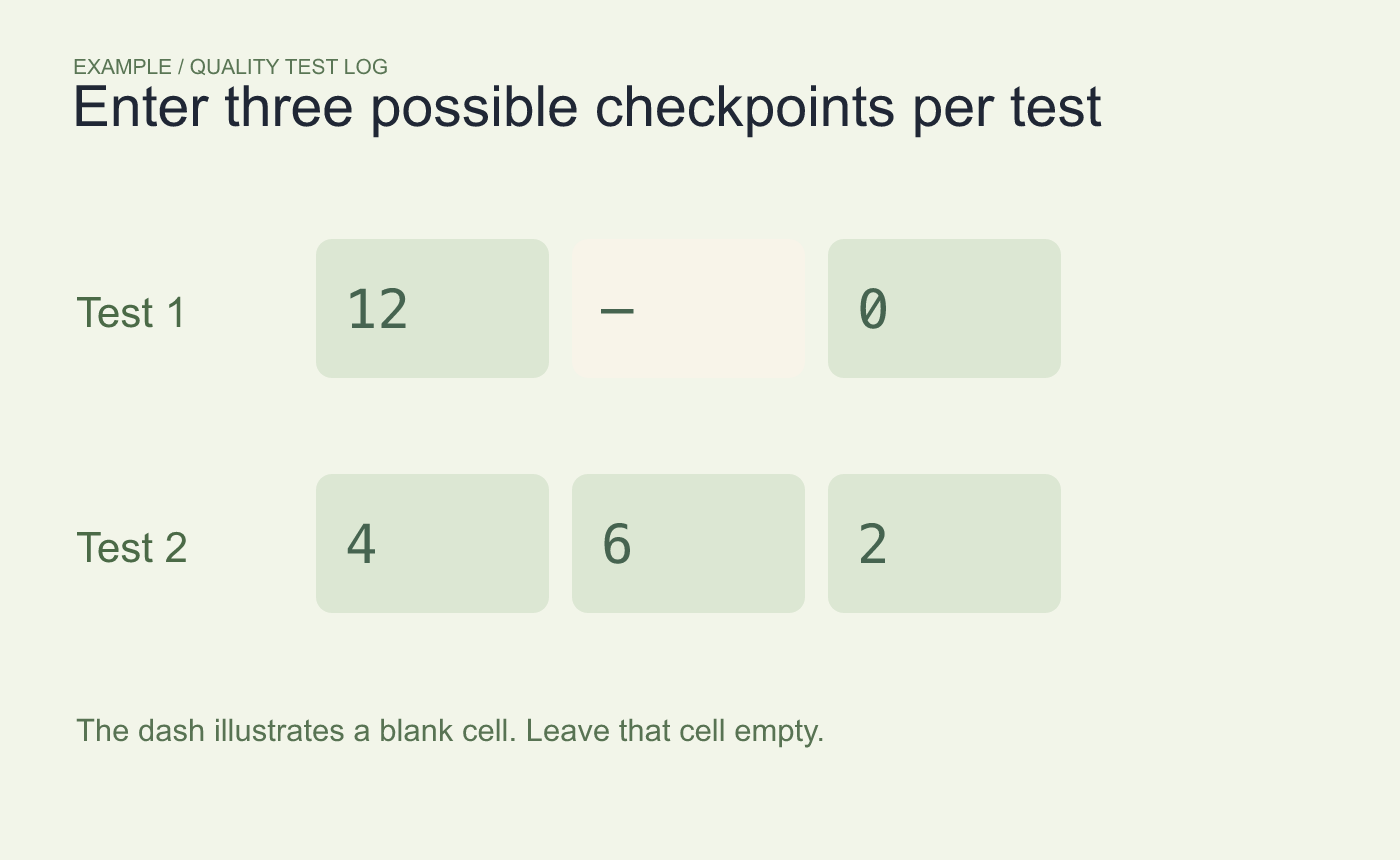
Example inputs. The zero represents a recorded measurement.
Check the blank and the zero separately
Expect 2 for the first test and 3 for the second. In a working copy, enter a numeric 0 in C2. The first count should rise to 3. A text note in that cell should leave the count at 2. Use a different rule if the project records completion as a status word.
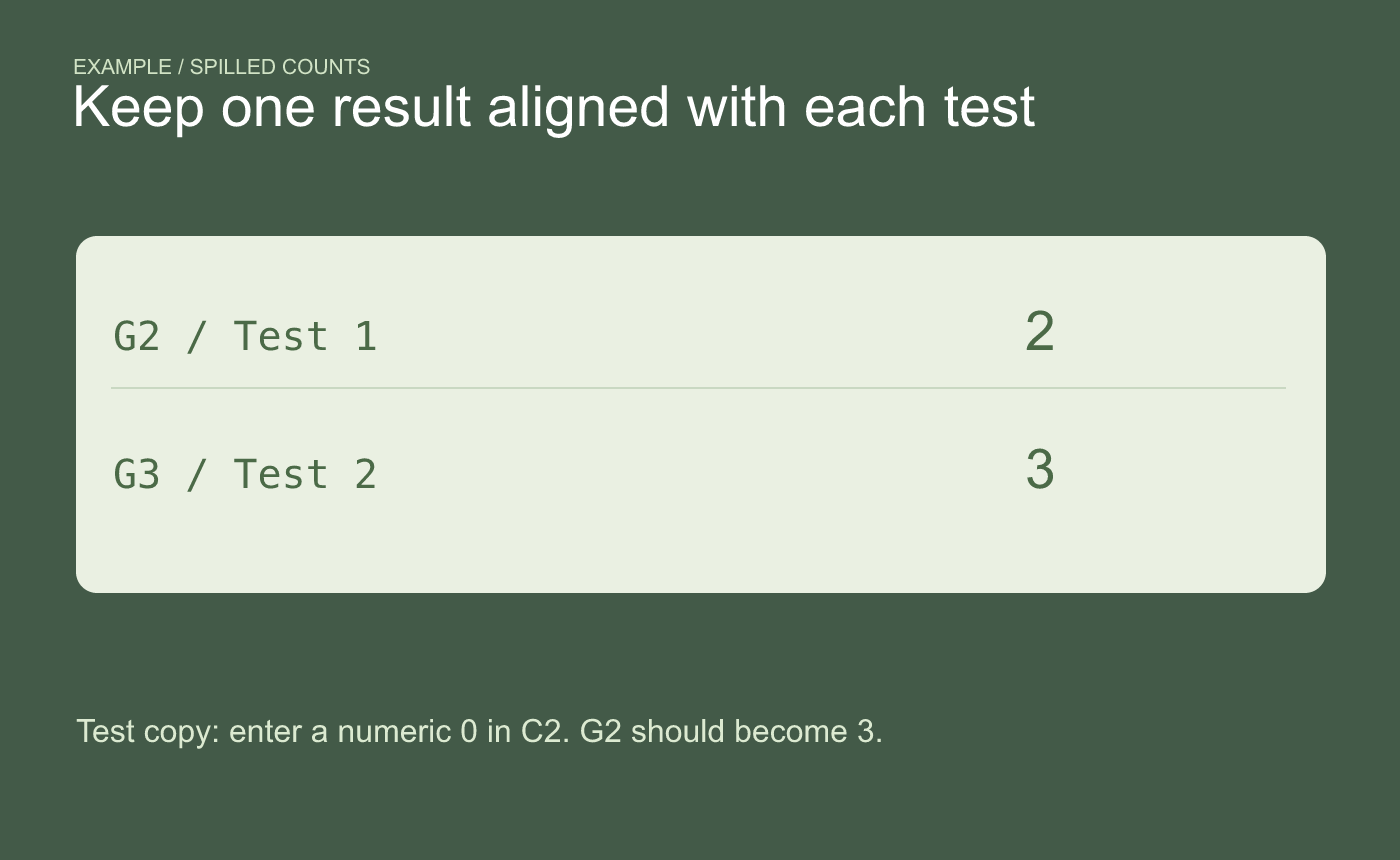
Example check. One result should line up with each test row.
Keep the output next to its source records and check the input range whenever a test row is appended.