The cold-store log records −8, −3, −6 and −2 °C in time order. You want to see the highest observed temperature up to each reading. A seed of zero would make the result warmer than every measurement.
Start with the first real reading
Enter -8, -3, -6 and -2 as numbers in B2:B5. In a spreadsheet editor with SCAN and LAMBDA, clear D2:D5 and enter the following in D2.
=SCAN(B2,B2:B5,LAMBDA(best,current,MAX(best,current)))Using B2 as the seed compares the first reading with itself at the first step. The result should be −8, −3, −3 and −2.
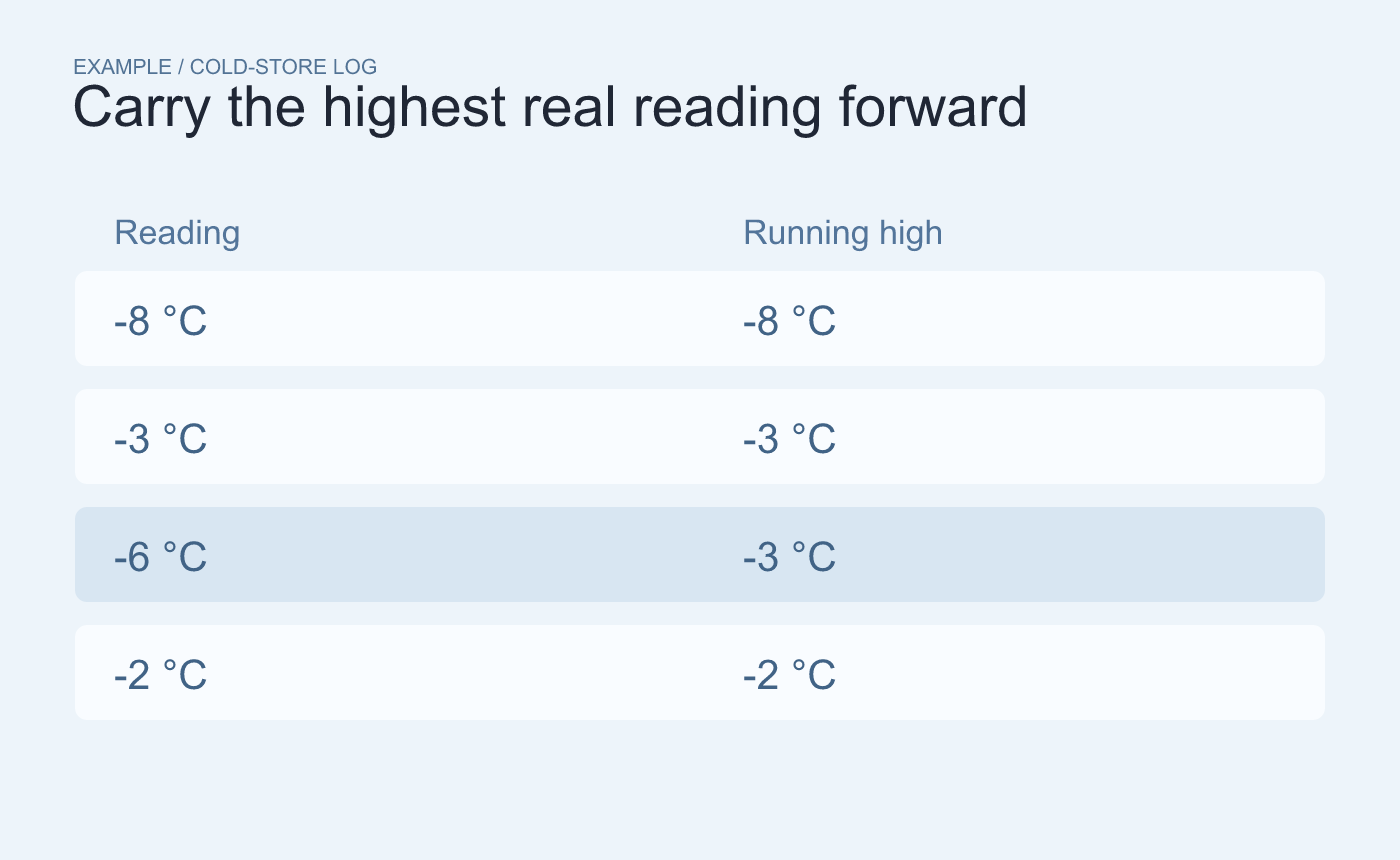
Example series. The first real reading seeds the running maximum.
Look at the dip and the new high
The third reading drops to −6, so the running high remains −3. The fourth raises the high to −2. In a test copy, try 0 as the seed and notice that it carries through all four rows even though the sensor never recorded 0.
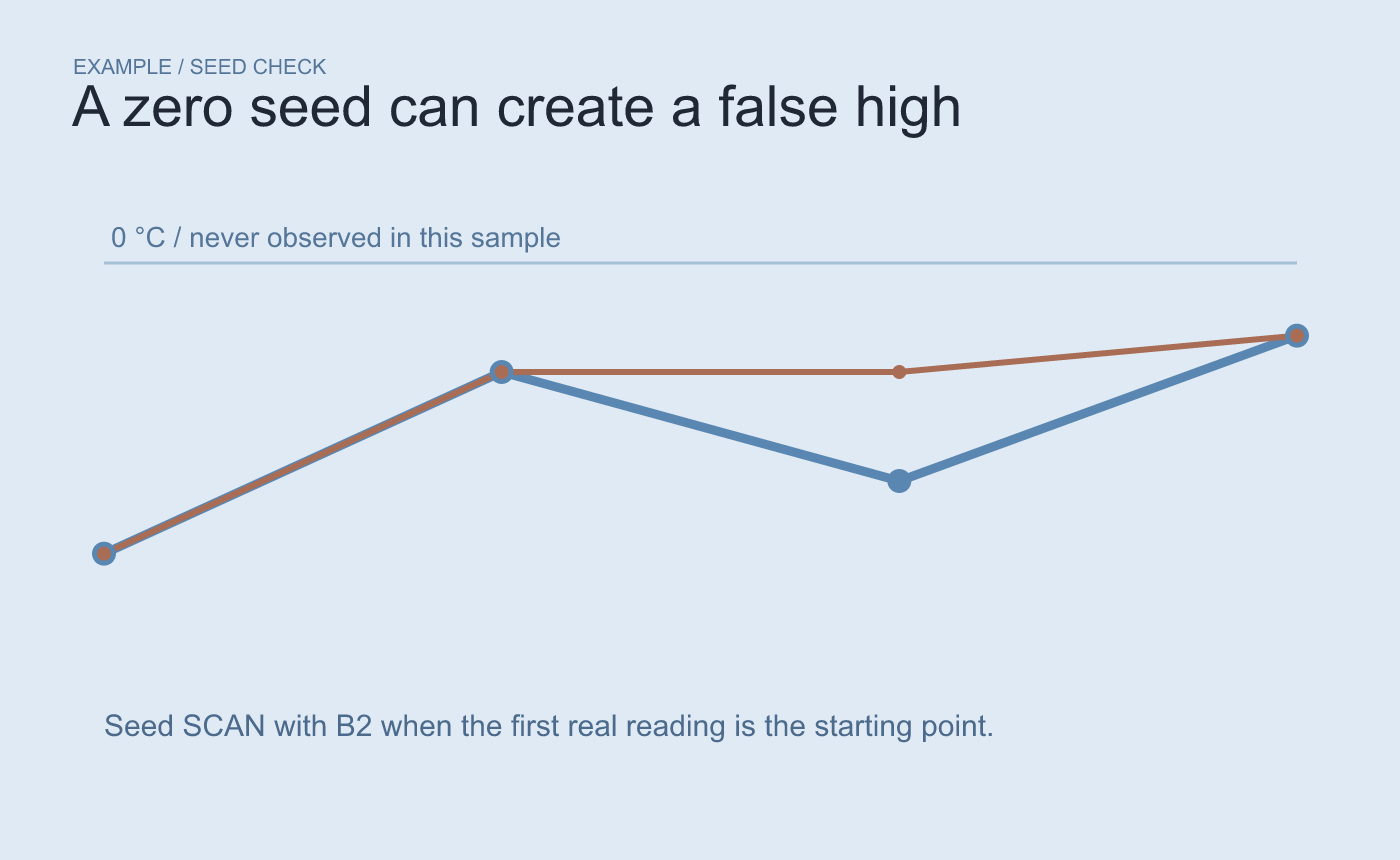
Example error check. The running high should always be a value observed in the series.
Check the timestamp order before using the running high in a chart. A different row order changes when each new high appears.