The dashboard has room for sixteen sensors, but the trial only supplied a two-row, three-column grid. Pad the view to the fixed shape without replacing the real zero in the source data.
In A2:C3 enter 12, 0 and 9 on the first row, then 7, 6 and 4 on the second. Keep E2:H5 empty so the expanded array can spill.
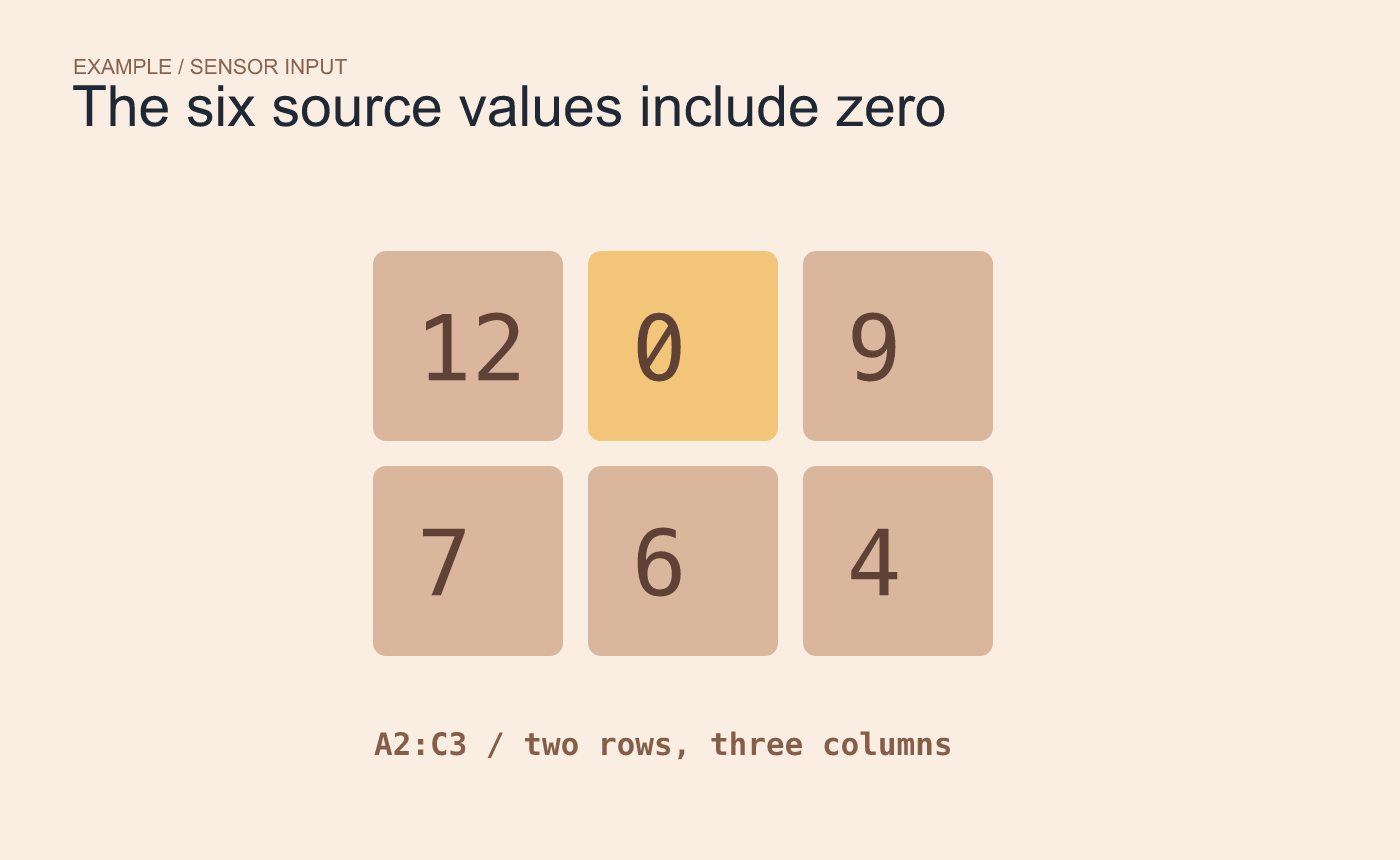
Example input. Zero is a recorded reading.
In E2, enter =EXPAND(A2:C3,4,4,"—"). The first size is the row count, and the second is the column count. The dash marks each added position.
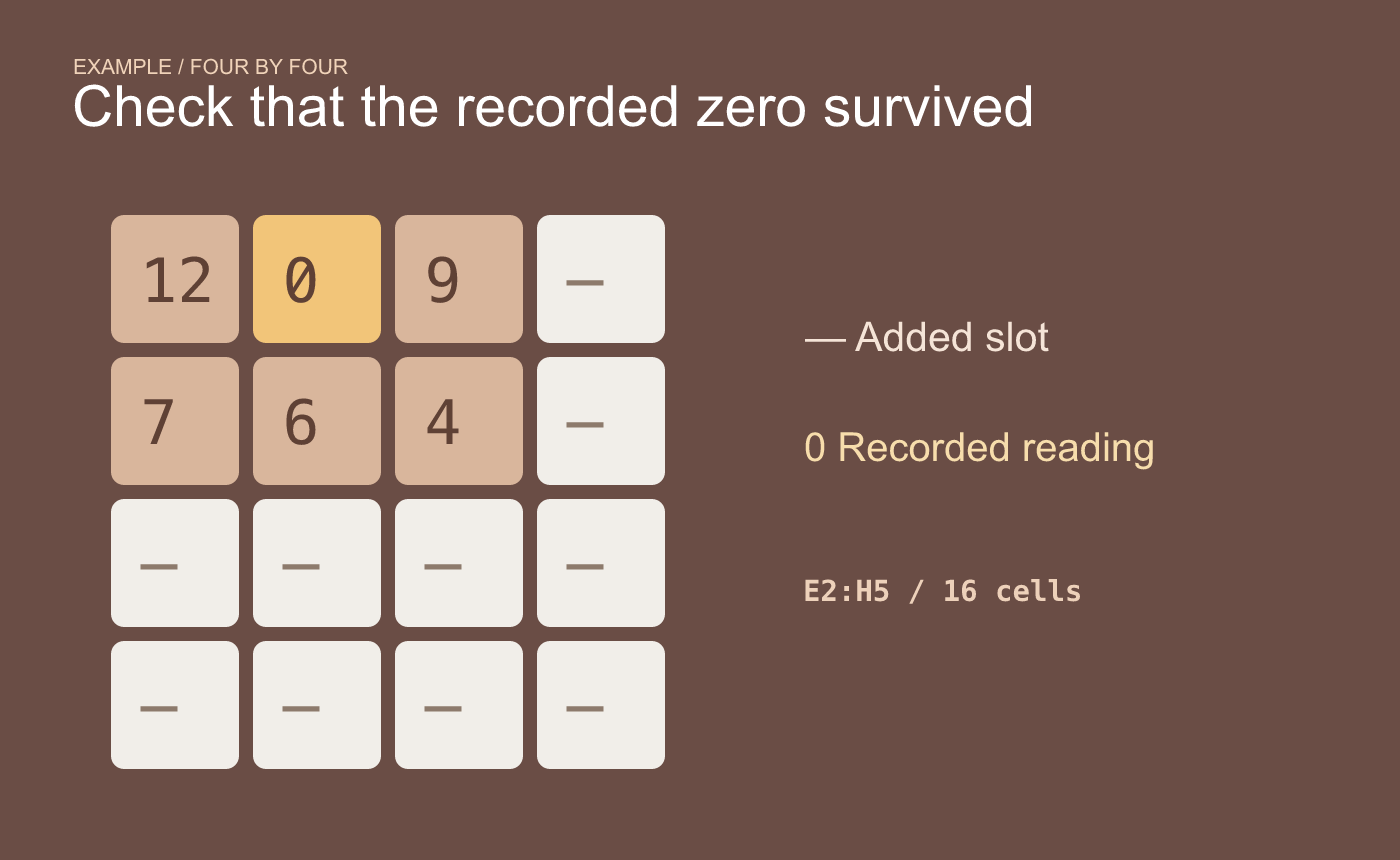
Example output. The dash labels a position that EXPAND added.
Check that F2 still contains the numeric zero. The added fourth column and bottom two rows account for ten padded slots. If a later calculation uses the grid, make sure its handling of the text markers matches the report’s rules.