For a positive starting value, percentage change is the new value minus the old value, divided by the old value. From 100 to 125, the change is (125-100)/100, or 25%.
When the old value is zero, that division is undefined. Show the new value and the absolute change, and use a clear label for the percentage field.
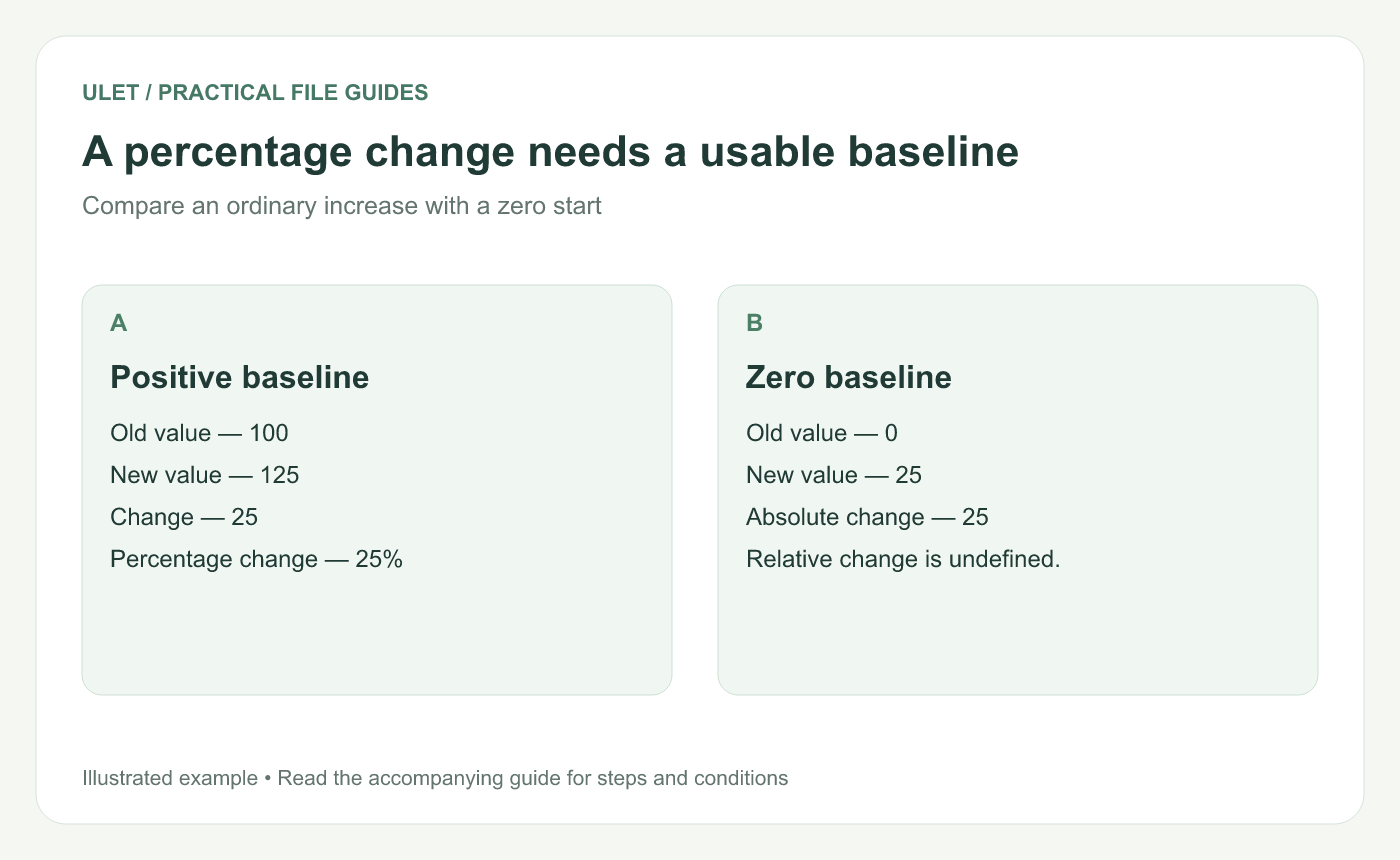
Compare an ordinary increase with a zero start. Original instructional illustration.
Keep the baseline visible
Old value | New value | Absolute change | Percentage change |
|---|---|---|---|
100 | 125 | 25 | 25% |
0 | 25 | 25 | n/a — zero baseline |
0 | 0 | 0 | n/a — zero baseline |
For zero to zero, the absolute values show no change. A conventional relative percentage still requires a nonzero denominator. Explain the label so readers know what the comparison can establish.
Guard the formula
If A2 holds the old value and B2 holds the new value, a common spreadsheet formula is =IF(A2=0,"n/a",(B2-A2)/A2). Format the numeric results as percentages and keep the meaning of n/a clear in the column heading or note.
You can calculate absolute change separately with =B2-A2. That remains useful for the zero-baseline examples.
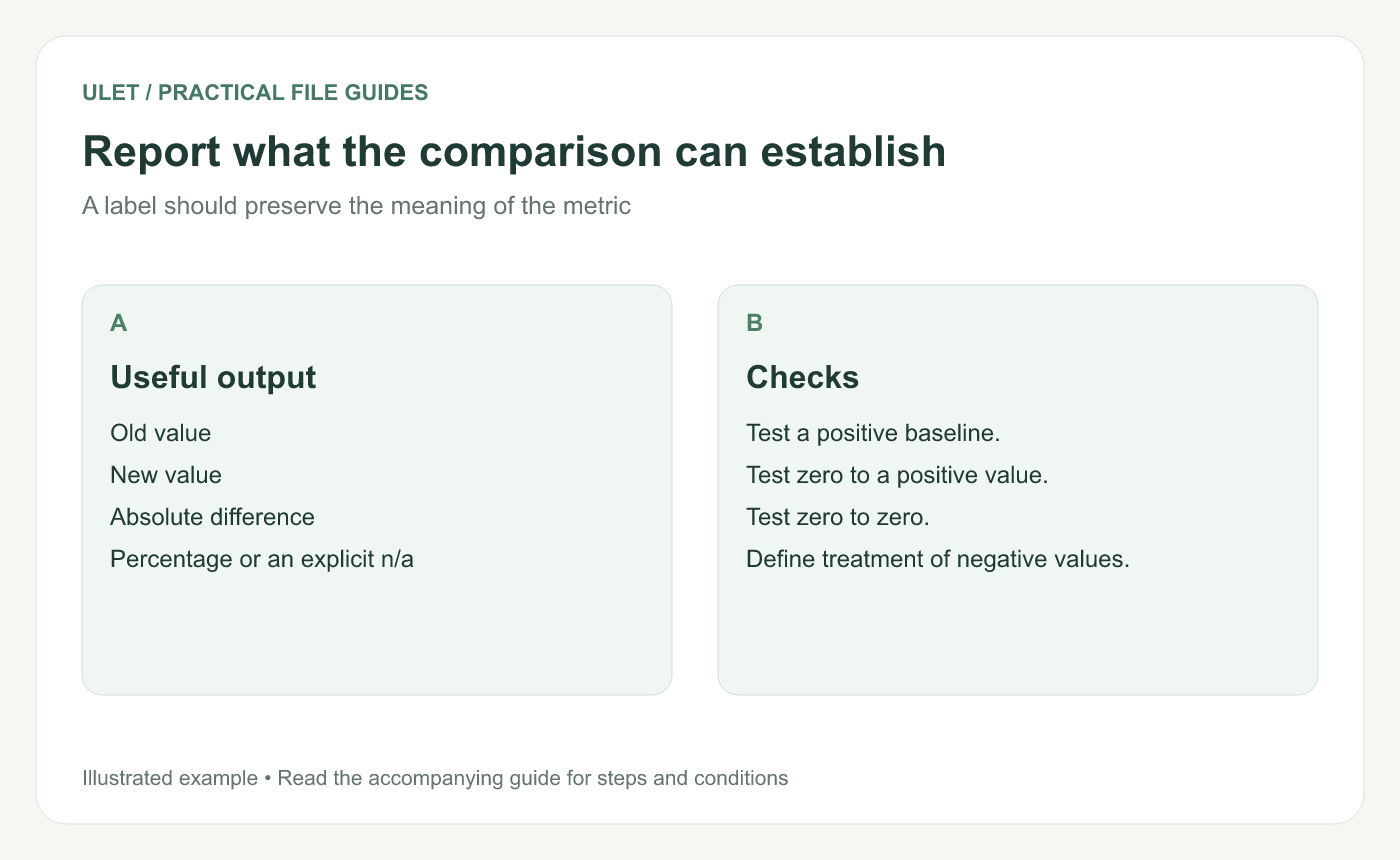
A label should preserve the meaning of the metric. Original instructional illustration.
Check the cases your data can contain
A positive baseline with an increase
A positive baseline with a decrease
A zero baseline and a positive new value
Zero to zero
Missing values and any negative baselines
A missing measurement is different from a measured zero. Decide how missing data should be labeled before applying the formula across a report.
Define unusual comparisons with the metric owner
Negative starting values can make the usual interpretation confusing. Agree on the comparison the report needs and explain the chosen definition. Avoid silently changing the formula just to produce a percentage.
Ulet lets you edit and review formulas in a local XLSX. Try the small table and check the saved results before applying the calculation to a larger workbook. Open and save an XLSX with Ulet.