
Use a column chart to compare monthly amounts and a line chart to emphasize their sequence over time. Choose the question first, then plot the same clearly defined metric for each month.
For example, suppose a sample table records 120, 150 and 135 units dispatched in September, October and November 2026. Both charts can show those values, but they guide the reader's attention differently.
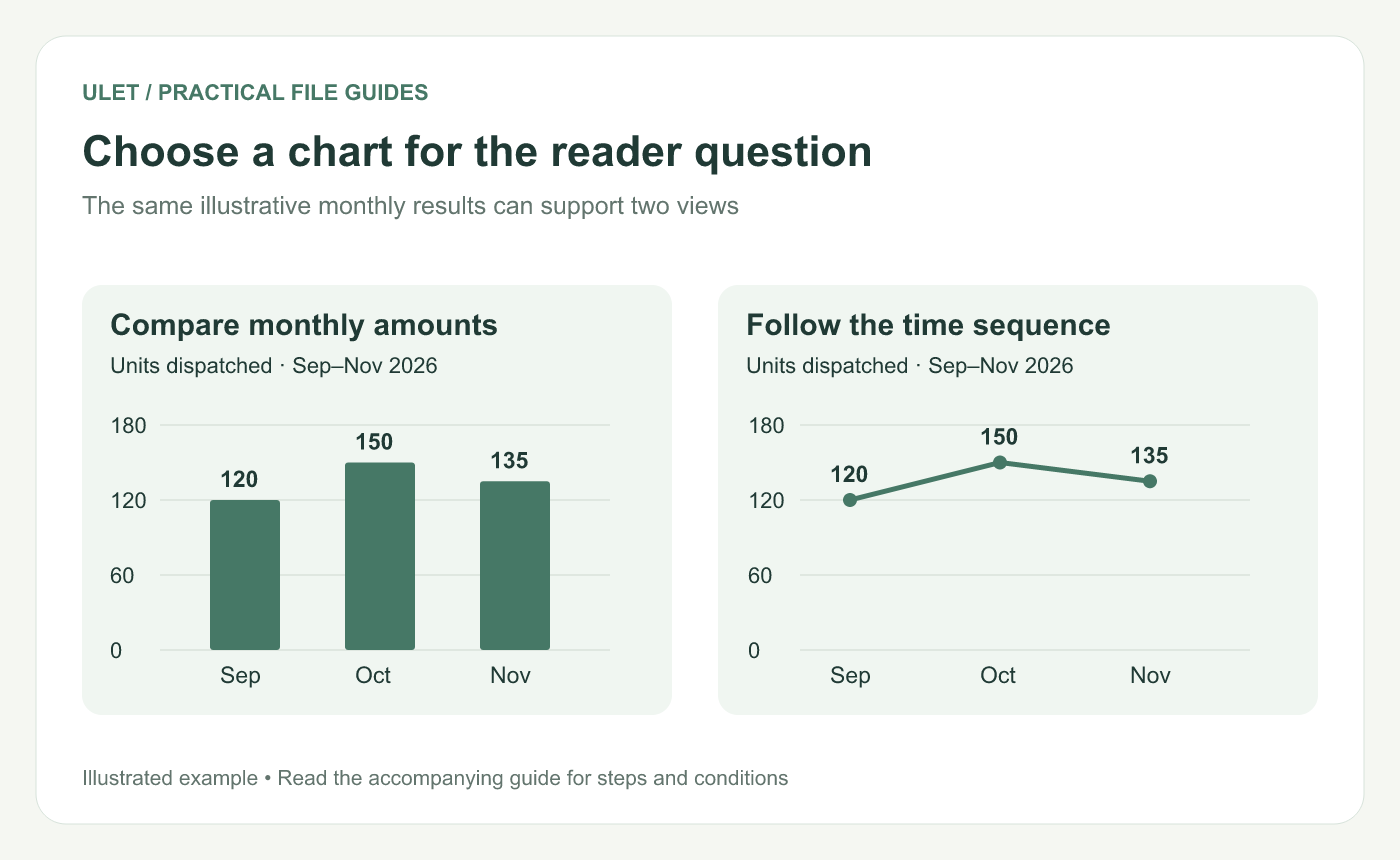
Choose a chart for the reader question. Original instructional illustration; the examples are not software screenshots.
Keep the source table small and explicit
Month | Units dispatched |
|---|---|
September 2026 | 120 |
October 2026 | 150 |
November 2026 | 135 |
Include the year, unit and definition of the measure. “Monthly results” leaves too much open: it might mean orders placed, units dispatched or cash received.
Keep a total row outside the chart's source selection. Plotting a three-month total as though it were a fourth month changes the comparison.
Choose the view that supports the sentence
“October had the highest dispatched volume” works well with columns. Start the columns at zero so their lengths represent the amounts fairly.
“Dispatch volume rose in October and eased in November” works well with a line through the calendar sequence. Microsoft describes line charts as useful for trends at regular intervals and explains how they differ from scatter charts with a numeric horizontal axis. Line and scatter chart guide.
Keep months in time order. If your measurements are irregularly spaced actual dates, check that the horizontal axis represents those intervals as intended.
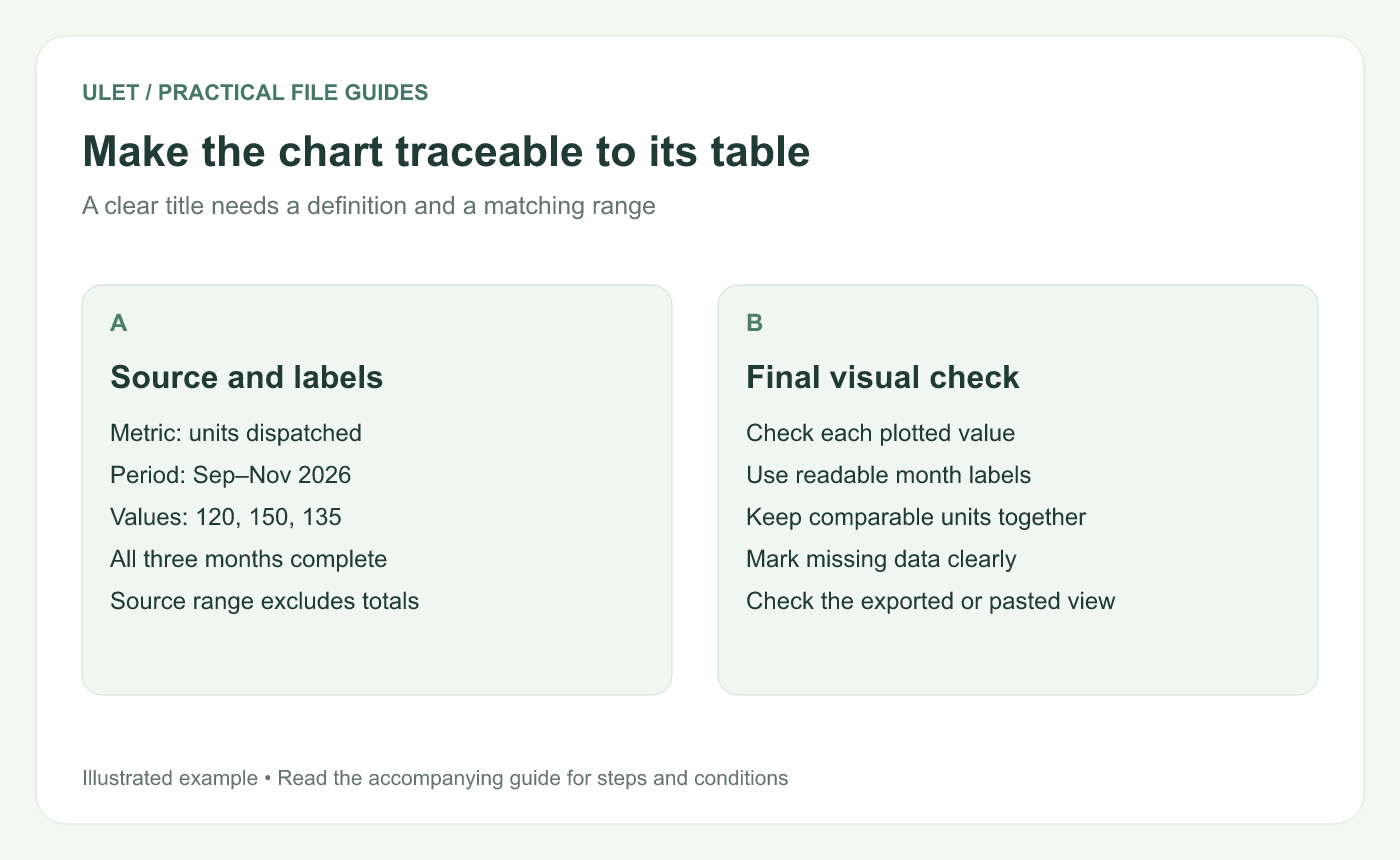
Make the chart traceable to its table. Original instructional illustration; the examples are not software screenshots.
Say what missing and incomplete months mean
A blank month is not necessarily zero. Find out whether the measurement is missing, not applicable or a genuine zero, then represent that meaning deliberately. Check whether the chosen chart connects across a gap or displays it.
If the current month is only partly complete, label its cutoff date. Comparing it with full months without explanation invites the wrong conclusion.
Check the plotted result against the cells
Select the intended month and value range in your chart-capable editor, create the chosen chart and inspect its title, axis labels and series. Microsoft's chart creation guide explains those elements for Excel.
Trace each point back to the three sample values. Then inspect the exported image or pasted slide at its actual reading size.
Ulet can keep the source XLSX and presentation work local in one app. Use the table as the reference when reviewing the final visual.


