
To put spreadsheet results on one slide, choose one finding and carry its definition, reporting period and source with it. Show enough evidence for the audience to understand the result without opening the workbook.
Check the calculation first. Slide design should make a sound result easier to read; it cannot repair a metric whose inputs or meaning are unclear.
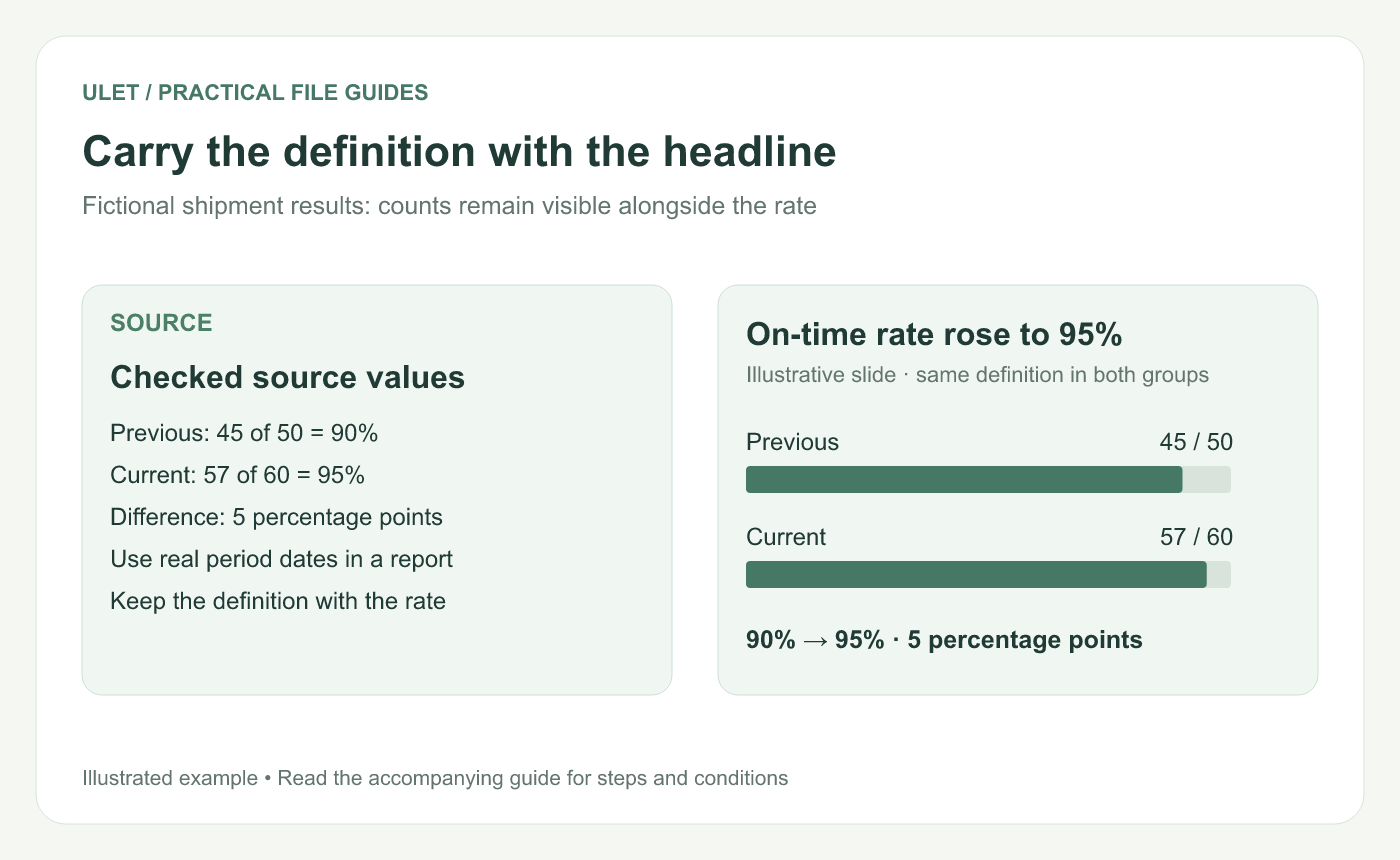
Carry the definition with the headline. Original instructional illustration; example values and layouts are illustrative, not software screenshots.
Start with a small, checked example
Suppose a fictional shipment table records 45 of 50 shipments on time in the previous period and 57 of 60 in the current period. The rates are 90% and 95%.
A useful title is “On-time shipment rate rose to 95%.” The supporting visual can show the two rates with the counts beside them. Use actual dates and the agreed definition of “on time” in a real report.
Keep counts beside percentages
Period | On-time shipments | All included shipments | Rate |
|---|---|---|---|
Previous | 45 | 50 | 90% |
Current | 57 | 60 | 95% |
The counts show the size of each period's group. A percentage on its own conceals that context.
The difference is five percentage points: 95% minus 90%. It is not the same calculation as relative percentage change. If the presentation needs relative change, define and calculate that separately.
Use one simple evidence area
Keep the main comparison prominent and place the period labels and counts close to it. A compact table may be clearer than a chart if the exact values are the point. Avoid pasting an entire worksheet with unreadable row labels.
Put the definition, exclusions and source in a readable note. Detail that would change the conclusion should remain visible, even when other supporting material moves to the appendix.
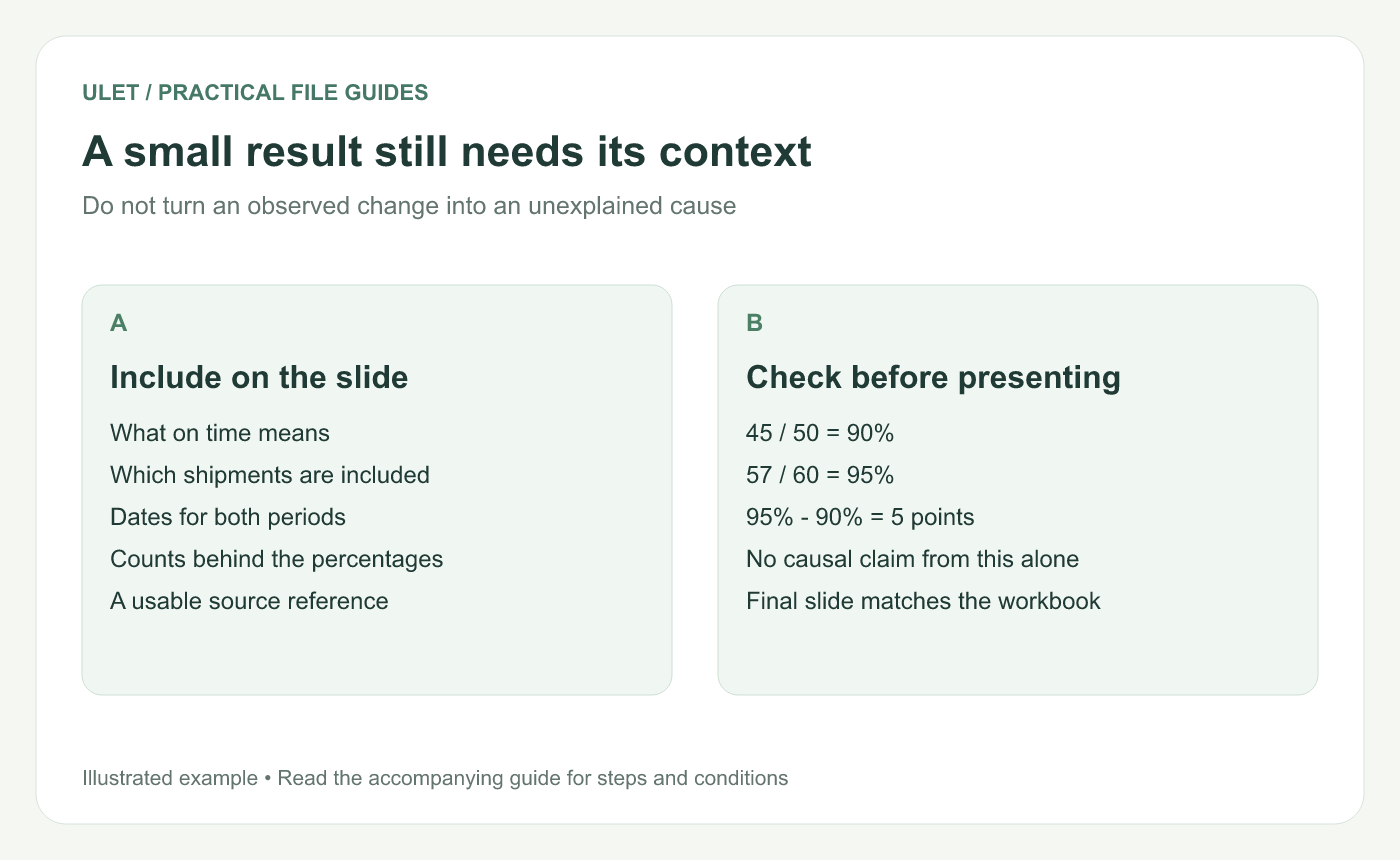
A small result still needs its context. Original instructional illustration; example values and layouts are illustrative, not software screenshots.
Say what the change does and does not establish
The sample shows an observed increase between two groups of shipments. It does not, by itself, prove why the rate changed. Check whether the periods use comparable rules and whether missing or excluded records matter.
If the slide asks for action, connect that action to the evidence: “Review late-shipment reasons before choosing the next intervention” is more specific than “Keep improving.”
Check the final slide against the source
Confirm the numerator, denominator and dates for both groups.
Inspect rounding and the percentage-point label.
Check the source reference and any exclusions.
Read the slide at the size the audience will see.
Ulet keeps local spreadsheet and presentation editing in one app. Maintain the checked XLSX alongside the PPTX so the values can be reviewed when the slide changes.


